Introduction
Breeze is a numerical processing library for Scala. It's a great tool for data science and machine learning. It's also used by Spark.
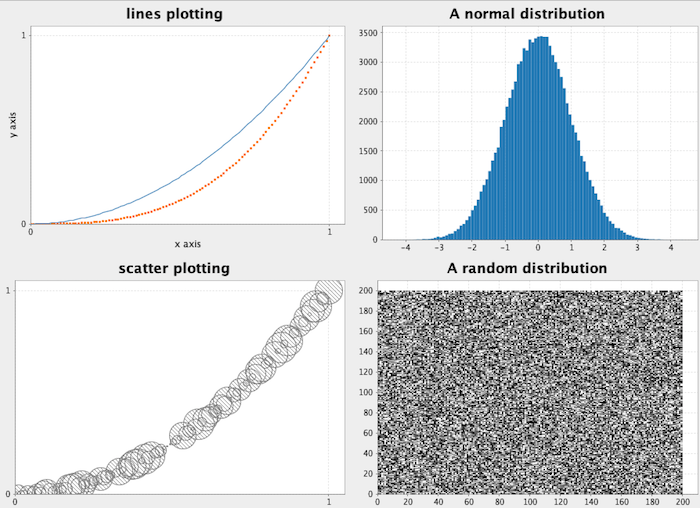
Visualization is important for data science and machine learning. Breeze provide breeze-viz for this. However it has only 4 kinds of plots -- line, scatter, histogram and image.
plotly-scala is the Scala bindings for plotly.js. It support a few of plots provided by plotly.
Here are some examples of both libraries based on their documentations.
Breeze-viz
import $ivy.`org.scalanlp::breeze:0.13.2`
import $ivy.`org.scalanlp::breeze-natives:0.13.2`
import $ivy.`org.scalanlp::breeze-viz:0.13.2`
import breeze.linalg._
import breeze.numerics._
import breeze.plot._

val fig = Figure()

val p = fig.subplot(0)
val x = linspace(0.0, 1.0)
p += plot(x, x ^:^ 2.0)
p += plot(x, x ^:^ 3.0, '.')
p.title = "lines plotting"
p.xlabel = "x axis"
p.ylabel = "y axis"

val p2 = fig.subplot(2, 2, 1)
val g2 = breeze.stats.distributions.Gaussian(0, 1)
p2 += hist(g2.sample(100000), 100)
p2.title = "A normal distribution"

val p3 = fig.subplot(2, 2, 2)
val x3 = linspace(0.0, 1.0, 100)
val size3 = 0.1 * DenseVector.rand(100)
p3 += scatter(x3, x3 ^:^ 2.0, size3.apply)
p3.title = "scatter plotting"

val p4 = fig.subplot(2, 2, 3)
p4 += image(DenseMatrix.rand(200, 200))
p4.title = "A random distribution"

Plotly
import $ivy.`org.plotly-scala::plotly-render:0.5.4`
import plotly._, element._, layout._, Plotly._

import $ivy.`org.scalanlp::breeze:0.13.2`
import breeze.linalg.DenseVector

implicit def fromDenseVectorDouble(v: DenseVector[Double]): Sequence = v.toArray.toVector
implicit def fromDenseVectorString(v: DenseVector[String]): Sequence = v.toArray.toVector
Scatter and Line
val trace1 = Scatter(
  Seq(1, 2, 3, 4),
  Seq(10, 15, 13, 17),
  name = "marker",
  mode = ScatterMode(ScatterMode.Markers))

val trace2 = Scatter(
  Seq(2, 3, 4, 5),
  Seq(16, 5, 11, 9),
  name = "line",
  mode = ScatterMode(ScatterMode.Lines),
  line = Line(dash = Dash.Dot))

val trace3 = Scatter(
  Seq(1, 2, 3, 4),
  Seq(12, 9, 15, 12),
  name = "line and marker",
  mode = ScatterMode(ScatterMode.Lines, ScatterMode.Markers))

Seq(trace1, trace2, trace3).plot(title = "Line and Scatter Plot")

val trace1 = Scatter(
  Seq(1, 2, 3, 4, 5),
  Seq(1, 6, 3, 6, 1),
  mode = ScatterMode(ScatterMode.Markers, ScatterMode.Text),
  name = "Team A",
  text = Seq("A-1", "A-2", "A-3", "A-4", "A-5"),
  textposition = TextPosition.TopCenter,
  textfont = TextFont("Raleway, sans-serif"),
  marker = Marker(size = 12))

val trace2 = Scatter(
  Seq(1.5, 2.5, 3.5, 4.5, 5.5),
  Seq(4, 1, 7, 1, 4),
  mode = ScatterMode(ScatterMode.Markers, ScatterMode.Text),
  name = "Team B",
  text = Seq("B-a", "B-b", "B-c", "B-d", "B-e"),
  textposition = TextPosition.BottomCenter,
  textfont = TextFont("Times New Roman"),
  marker = Marker(
    size = 20,
    color = Color.RGB(142, 124, 195)))

Seq(trace1, trace2).plot(
  "scatter.html",
  Layout(
    title = "Data Labels on The Plot",
    xaxis = Axis(
      range = (0.75, 5.25),
      title = "x line title",
      showgrid = false,
      zeroline = false),
    yaxis = Axis(
      range = (0, 8),
      title = "y line title",
      showline = false)),
  false,
  true,
  true)

Bubble
val trace1 = Scatter(
  1 to 4,
  10 to 13,
  mode = ScatterMode(ScatterMode.Markers),
  text = Seq("A<br>size: 40", "B<br>size: 60", "C<br>size: 80", "D<br>size: 100"),
  marker = Marker(
    color = Seq(Color.RGB(93, 164, 214), Color.RGB(255, 144, 14), Color.RGB(44, 160, 101), Color.RGB(255, 65, 54)),
    opacity = Seq(1, 0.8, 0.6, 0.4),
    size = Seq(40, 60, 80, 100),
    symbol = Seq(Symbol.Circle(), Symbol.Square(), Symbol.Diamond(), Symbol.Cross())))

Seq(trace1).plot(
  "bubble.html",
  Layout(
    title = "Bubble Chart Hover Text",
    showlegend = false,
    height = 600,
    width = 600),
  false,
  true,
  true)

Bar
val monthes = Seq("Jan", "Feb", "Mar", "Apr", "May", "Jun", "Jul", "Aug", "Sep", "Oct", "Nov", "Dec")

val trace1 = Bar(
  monthes,
  Seq(20, 14, 25, 16, 18, 22, 19, 15, 12, 16, 14, 17),
  "Primary Product",
  text = monthes.map(x => x + "!"),
  // orientation = Orientation.Horizontal,
  marker = Marker(
    color = Color.RGB(49, 130, 189),
    opacity = 0.7))

val trace2 = Bar(
  monthes,
  Seq(19, 14, 22, 14, 16, 19, 15, 14, 10, 12, 12, 16),
  "Secondary Product",
  text = monthes.map(x => x + "?"),
  // orientation = Orientation.Horizontal,
  marker = Marker(
    color = Color.RGB(204, 204, 204),
    opacity = 0.5))

Seq(trace1, trace2).plot(
  "bar.html",
  Layout(
    title = "2013 Sales Report",
    xaxis = Axis(tickangle = -45),
    yaxis = Axis(
      title = "Amount",
      titlefont = Font(size = 20, color = Color.RGB(107, 107, 107))),
    barmode = BarMode.Group,
    bargroupgap = 0.1),
  false,
  true,
  true)

Filled Area
val trace1 = Scatter(
  1 to 4,
  Seq(0, 2, 3, 5),
  fill = Fill.ToZeroY)

val trace2 = Scatter(
  1 to 4,
  Seq(3, 5, 1, 7),
  fill = Fill.ToZeroY)

Seq(trace1, trace2).plot()

Time Series
val src = scala.io.Source.fromFile("finance-charts-apple.csv")
val headers = src.getLines.take(1).next.split(",")
val datesBuf = collection.mutable.ArrayBuffer.empty[String]
val highsBuf = collection.mutable.ArrayBuffer.empty[Double]
val lowsBuf = collection.mutable.ArrayBuffer.empty[Double]

for (line <- src.getLines.map(_.split(","))) {
  datesBuf += line(headers.indexOf("Date"))
  highsBuf += line(headers.indexOf("AAPL.High")).toDouble
  lowsBuf += line(headers.indexOf("AAPL.Low")).toDouble
}

val dates = DenseVector(datesBuf.toArray)
val highs = DenseVector(highsBuf.toArray)
val lows = DenseVector(lowsBuf.toArray)

val trace1 = Scatter(
  dates,
  highs,
  mode = ScatterMode(ScatterMode.Lines),
  line = Line(color = Color.StringColor("#17BECF")))

val trace2 = Scatter(
  dates,
  lows,
  mode = ScatterMode(ScatterMode.Lines),
  line = Line(color = Color.StringColor("#7F7F7F")))

Seq(trace1, trace2).plot(title = "Time Series")
src.close()

Subplots
val data = Seq(1, 2)

val trace1 = Scatter(
  data,
  data,
  name = "(1,1)")

val trace2 = Scatter(
  data,
  data,
  name = "(1,2)",
  xaxis = AxisReference.X2,
  yaxis = AxisReference.Y2)

val trace3 = Scatter(
  data,
  data,
  name = "(1,2)",
  xaxis = AxisReference.X3,
  yaxis = AxisReference.Y3)

val trace4 = Scatter(
  data,
  data,
  name = "(1,2)",
  xaxis = AxisReference.X4,
  yaxis = AxisReference.Y4)

Seq(trace1, trace2, trace3, trace4).plot(
  "subplots.html",
  Layout(
    title = "Mulitple Custom Sized Subplots",
    xaxis = Axis(
      anchor = AxisAnchor.Reference(AxisReference.Y1),
      domain = (0, 0.45)),
    yaxis = Axis(
      anchor = AxisAnchor.Reference(AxisReference.X1),
      domain = (0.5, 1)),
    xaxis2 = Axis(
      anchor = AxisAnchor.Reference(AxisReference.Y2),
      domain = (0.55, 1)),
    yaxis2 = Axis(
      anchor = AxisAnchor.Reference(AxisReference.X2),
      domain = (0.8, 1)),
    xaxis3 = Axis(
      anchor = AxisAnchor.Reference(AxisReference.Y3),
      domain = (0.55, 1)),
    yaxis3 = Axis(
      anchor = AxisAnchor.Reference(AxisReference.X3),
      domain = (0.5, 0.75)),
    xaxis4 = Axis(
      anchor = AxisAnchor.Reference(AxisReference.Y4),
      domain = (0, 1)),
    yaxis4 = Axis(
      anchor = AxisAnchor.Reference(AxisReference.X4),
      domain = (0, 0.45))),
  false,
  true,
  true)

Multiple Axes
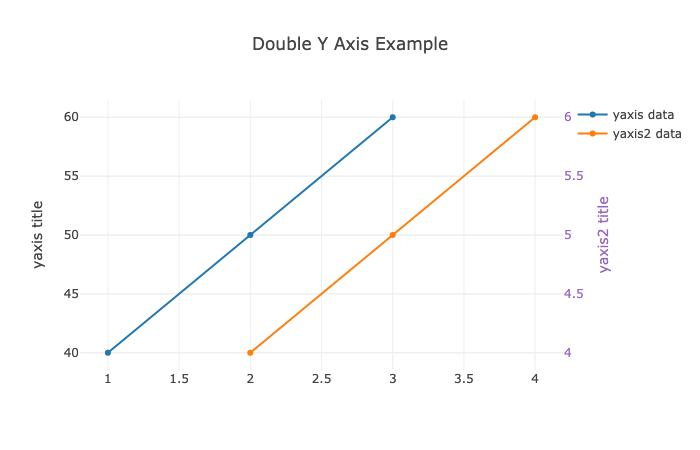
val trace1 = Scatter(
  1 to 3,
  Seq(40, 50, 60),
  name = "yaxis data")

val trace2 = Scatter(
  2 to 4,
  Seq(4, 5, 6),
  name = "yaxis2 data",
  yaxis = AxisReference.Y2)

Seq(trace1, trace2).plot(
  "axes.html",
  Layout(
    title = "Double Y Axis Example",
    yaxis = Axis(title = "yaxis title"),
    yaxis2 = Axis(
      title = "yaxis2 title",
      titlefont = Font(color = Color.RGB(148, 103, 189)),
      tickfont = Font(color = Color.RGB(148, 103, 189)),
      overlaying = AxisAnchor.Y,
      side = Side.Right)),
  false,
  true,
  true)

Histograms
val r = DenseVector.rand(500)
val x1 = r * 5.0
val x2 = r * 10.0
val y1 = r
val y2 = r * 2.0

val trace1 = Histogram(
  r * 5.0,
  r,
  name = "control",
  autobinx = false,
  histnorm = HistNorm.Count,
  marker = Marker(
    color = Color.RGBA(255, 10, 102, 0.7),
    line = Line(
      color = Color.RGBA(255, 100, 102, 1),
      width = 1)),
  opacity = 0.5,
  xbins = Bins(0.5, 2.8, 0.06))

val trace2 = Histogram(
  r * 10.0,
  r * 2.0,
  autobinx = false,
  marker = Marker(
    color = Color.RGBA(100, 200, 102, 0.7),
    line = Line(
      color = Color.RGBA(100, 200, 102, 1),
      width = 1)),
  name = "experimental",
  opacity = 0.75,
  xbins = Bins(-3.2, 4, 0.06))

Seq(trace1, trace2).plot(
  "histogram.html",
  Layout(
    bargap = 0.05,
    bargroupgap = 0.2,
    barmode = BarMode.Overlay,
    title = "Sampled Results",
    xaxis = layout.Axis(title = "Value"),
    yaxis = layout.Axis(title = "Count")),
  false,
  true,
  true)

Box
val y = Seq(0.75, 5.25, 5.5, 6, 6.2, 6.6, 6.80, 7.0, 7.2, 7.5, 7.5, 7.75, 8.15, 8.15, 8.65, 8.93, 9.2, 9.5, 10, 10.25, 11.5, 12, 16, 20.90, 22.3, 23.25)

val trace1 = Box(
  y = y,
  name = "All Points",
  jitter = 0.3,
  pointpos = -1.8,
  marker = Marker(
    color = Color.RGB(7, 40, 89)),
  boxpoints = BoxPoints.All)

val trace2 = Box(
  y = y,
  name = "Only Wiskers",
  marker = Marker(
    color = Color.RGB(9, 56, 125)),
  boxpoints = BoxPoints.False)

val trace3 = Box(
  y = y,
  name = "Suspected Outlier",
  marker = Marker(
    color = Color.RGB(8, 81, 156),
    outliercolor = Color.RGBA(219, 64, 82, 0.6),
    line = Line(
      outliercolor = Color.RGBA(219, 64, 82, 1.0),
      outlierwidth = 2)),
  boxpoints = BoxPoints.SuspectedOutliers)

val trace4 = Box(
  y = y,
  name = "Wiskers and Outliers",
  marker = Marker(
    color = Color.RGB(107, 174, 214)),
  boxmean = BoxMean.True,
  boxpoints = BoxPoints.Outliers)

Seq(trace1, trace2, trace3, trace4).plot(title = "Box Plot Styling Outliers")

